Debugging - Interpreting Error Messages
An incredibly useful debugging skill is to be able to interpret the ASP.NET error messages shown.
We've all seen these error pages and they'll give you useful clues where to look.
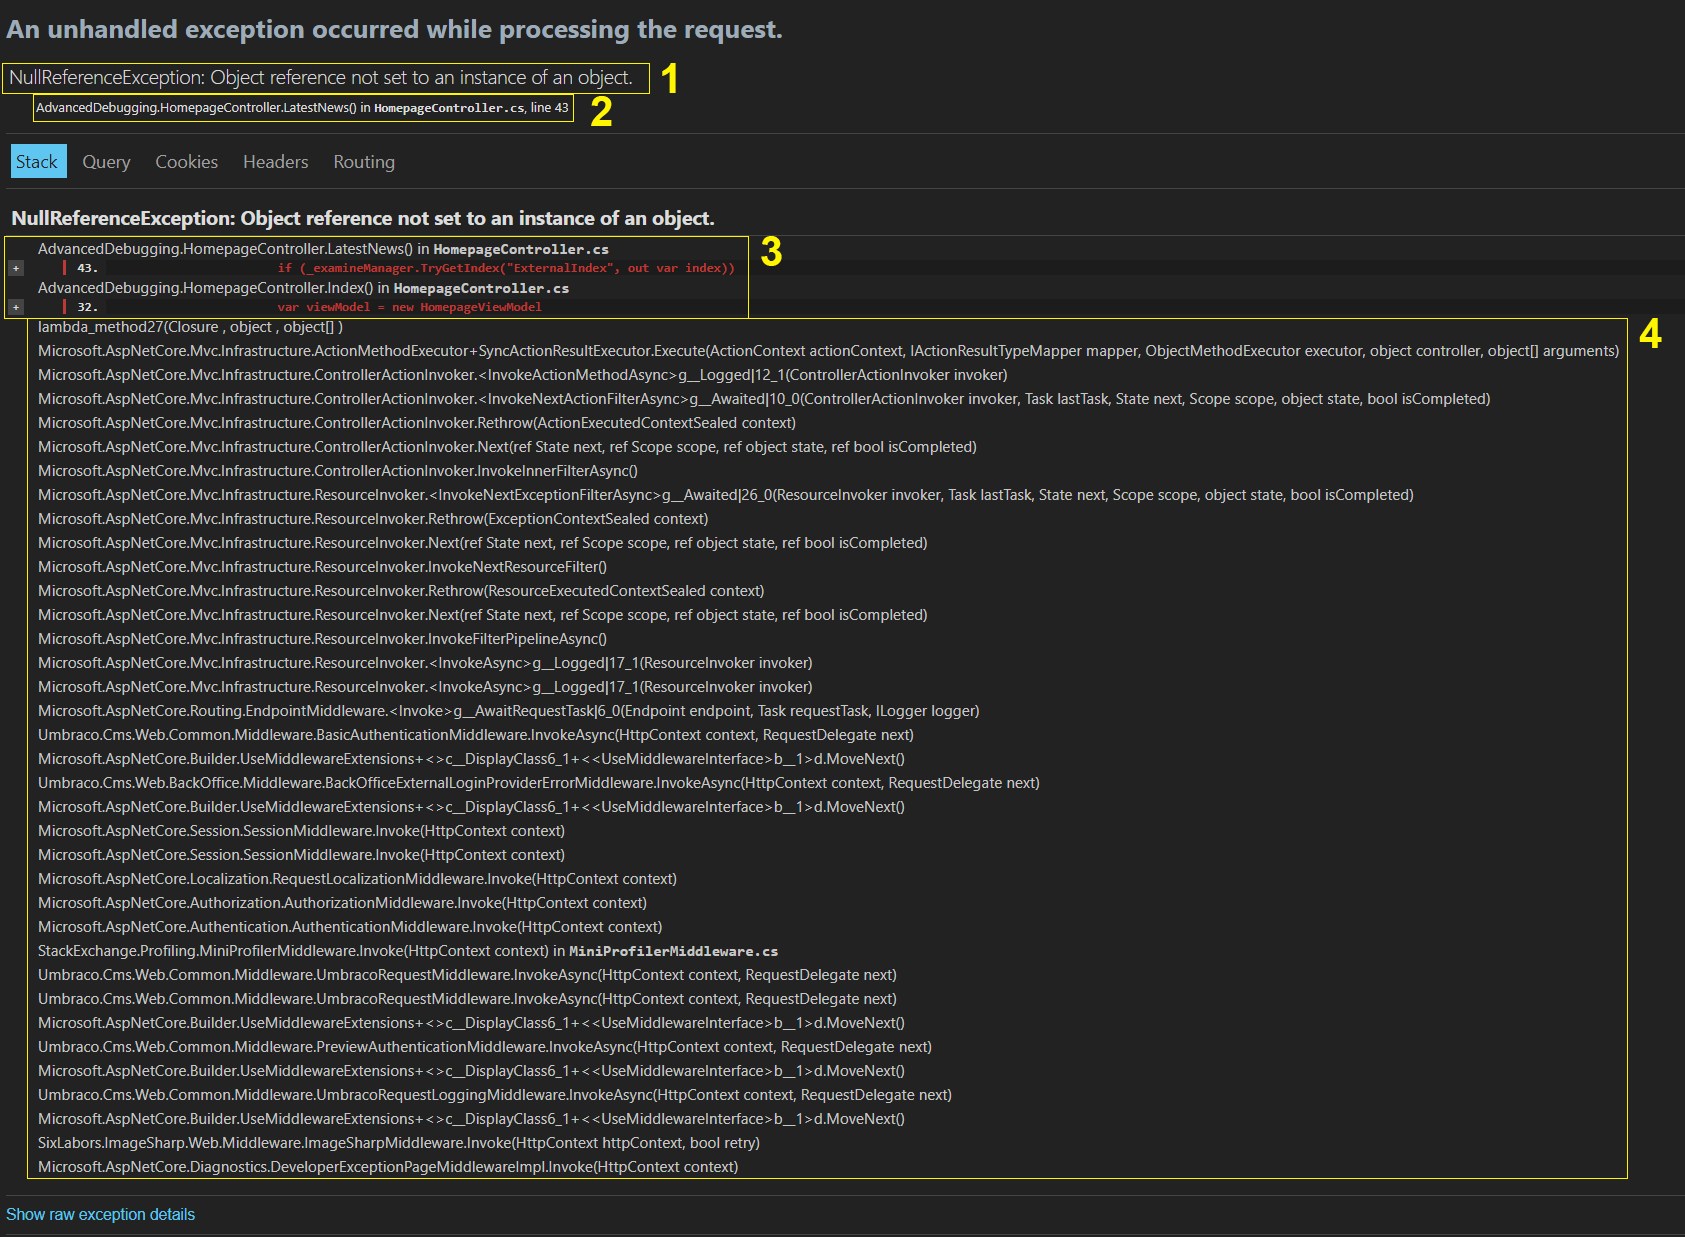
Here is an example of a ASP.NET error page
 This is one of the most common exceptions out there, it'll mean that a variable you are trying to use is not set to an actual instance of an object, so it's null. The way you are using it expects it to have a value so it's erroring.
Let's break down this error page:
1. This is the exception type and a brief description of the exception. Unfortunately these can sometimes be a bit cryptic and you'll need to look at the rest of the error page to determine the exact error.
2. This shows the function and the exact line of code where the exception occurred, usually this will be in your code. However sometimes it will be in a system or third party library in which case you should look through the stack trace (3 + 4 in this diagram) to see which part of your code is running before the exception.
3. This is a stack trace where it shows which parts of your code have run up to the point when the error occurred. In this case you can Index() in HomepageController was called. At line 32 execution left Index() to call LatestNews() and LatestNews() had an error on line 43.
4. This is the call stack before it entered your code, these are all system libraries showing the code ASP.NET executes before getting to your code.
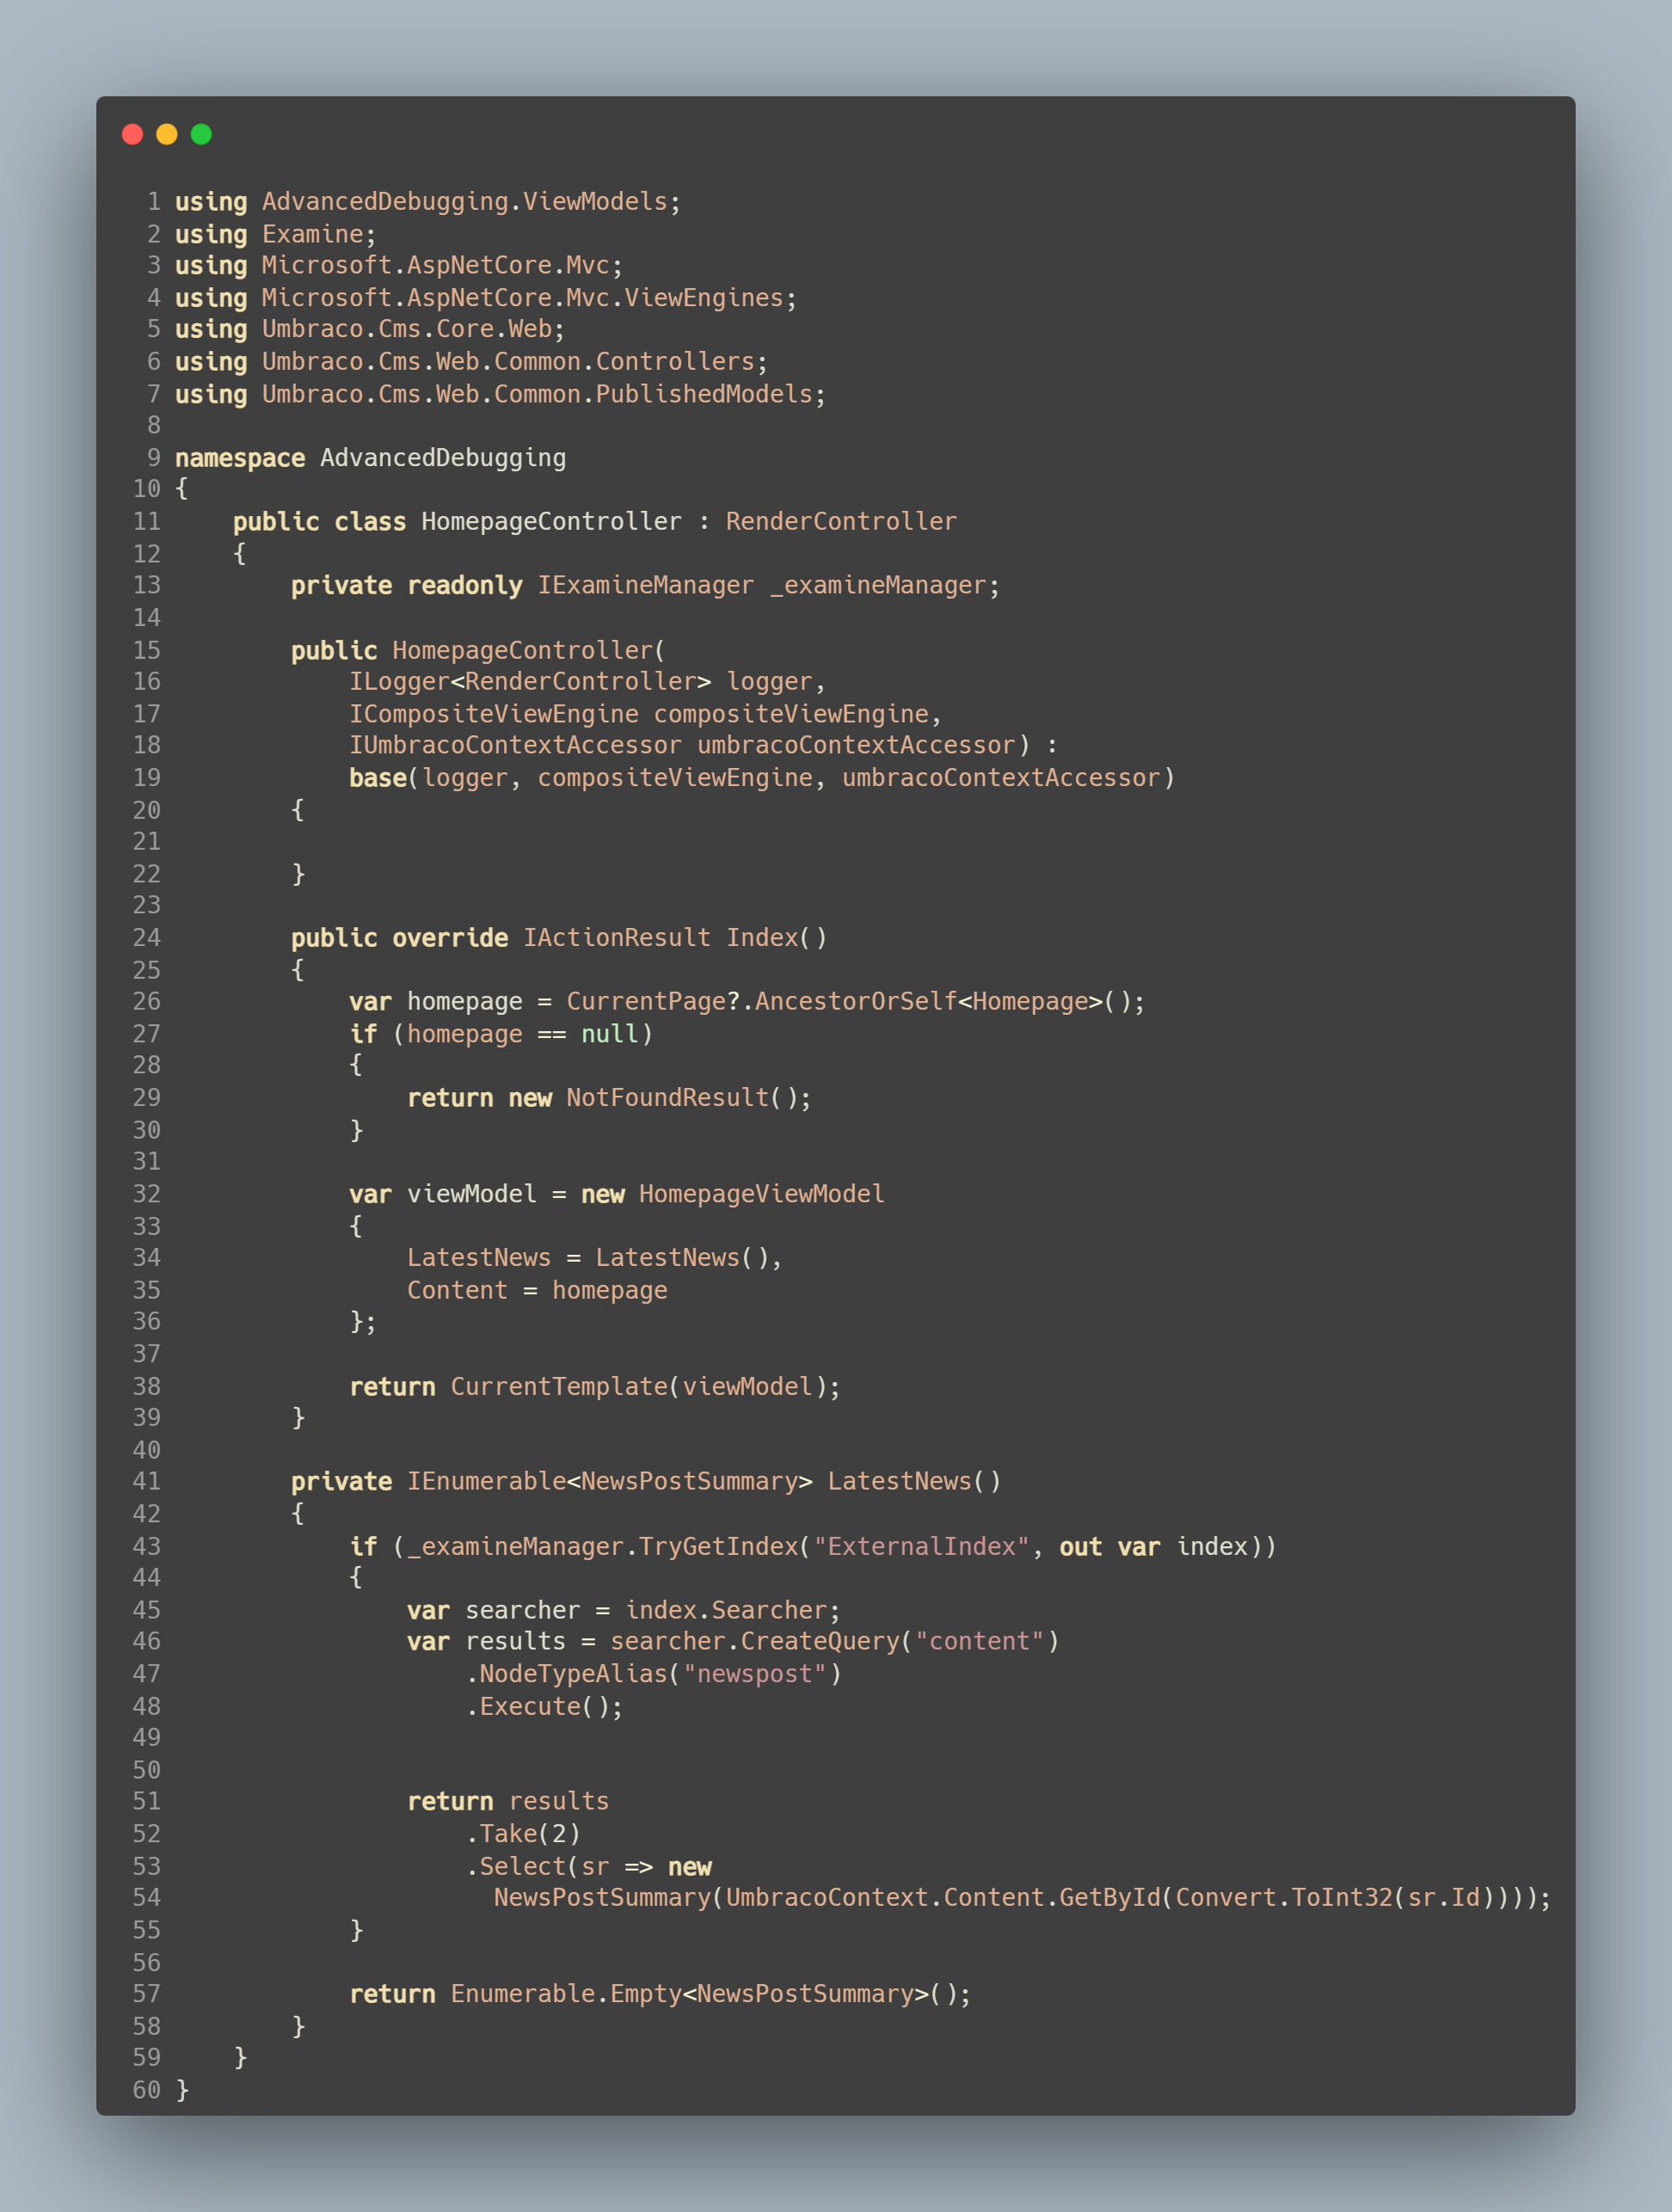
This is the code with the error:

You can see around that the _examineManager variable is declared but never initialised, so when it comes to be used on line 43, it is null. This is the cause of the NullReferenceException.
To fix this we should pass an IExamineManager in via the constructor and assign it to _examineManager in the constructor.
Hopefully that'll give you a basic introduction to debugging, in the next post I'll talk about breakpoints, stepping through the code and using watches to track variables as you move through the code as it runs.
